/ 2018 - 2019 / Pokémon Visualization ToolGroup project
ROLE: PROGRAMMER | WEBSITE
2IMV20 Visualization is a course that I followed at Eindhoven University of Technology.
The aim of this course was to introduce students to the theory and practice of data visualization.
The goal of the course was to get familiar with the aims and problematics of data visualization, and gain good knowledge on the theory, principles, methods which are frequently used in practice in the construction and use of data visualization applications.
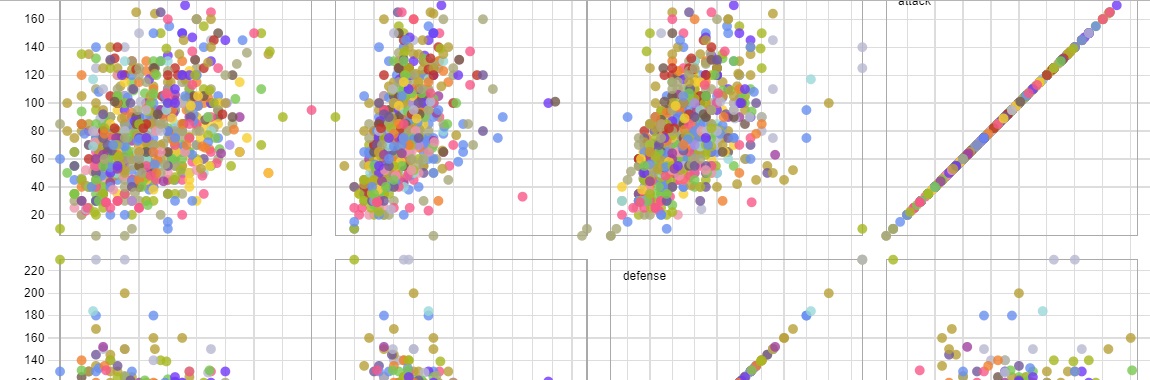
For one of the practicals of this course we had to design, implement, and customize a data visualization application of average complexity in order to get insight into a real-world dataset.
From a practical side of view, we needed to understand and apply various design and implementation trade-offs which are often encountered in the construction of visualization applications. I implemented the filter system, scatter plot matrix, table generation, highlight view and general web page.
As part of the course, we also created an overview video of the tool.